Histograms and Measures of Central Tendency
Not what you're looking for?
Please see the attached file for the fully formatted problems.
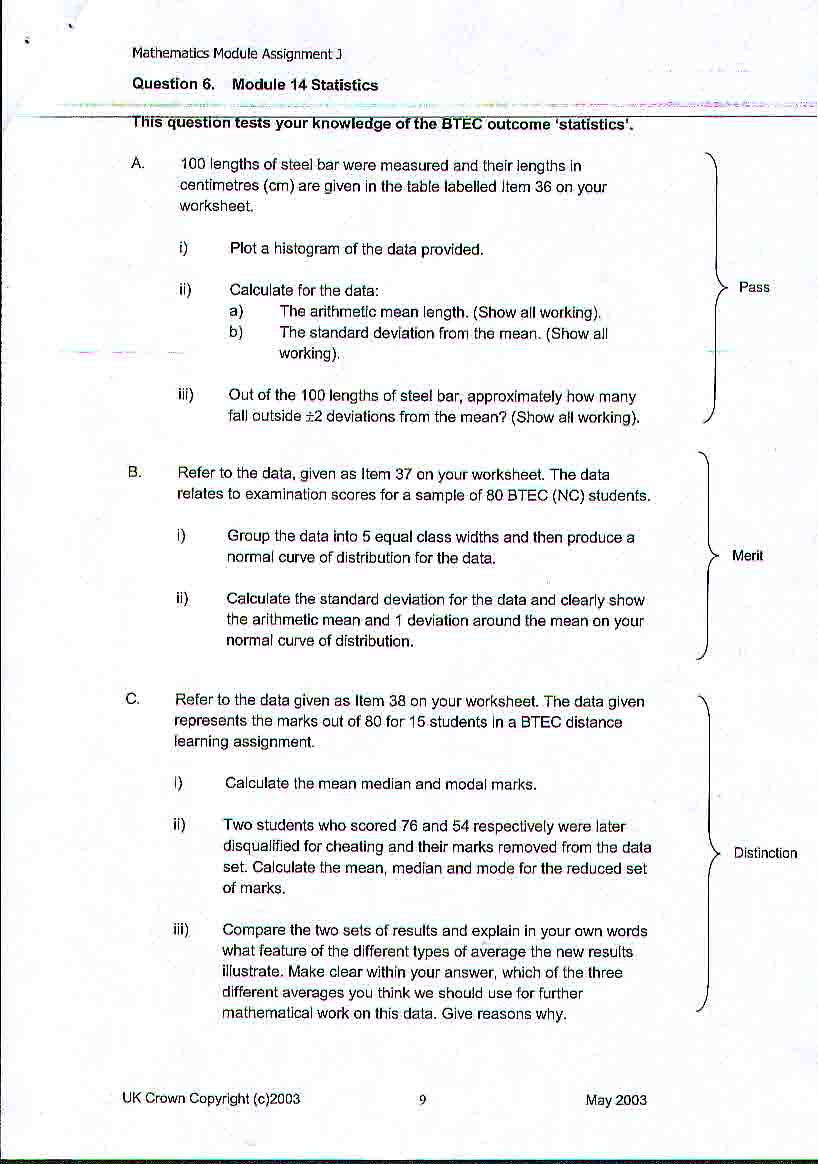
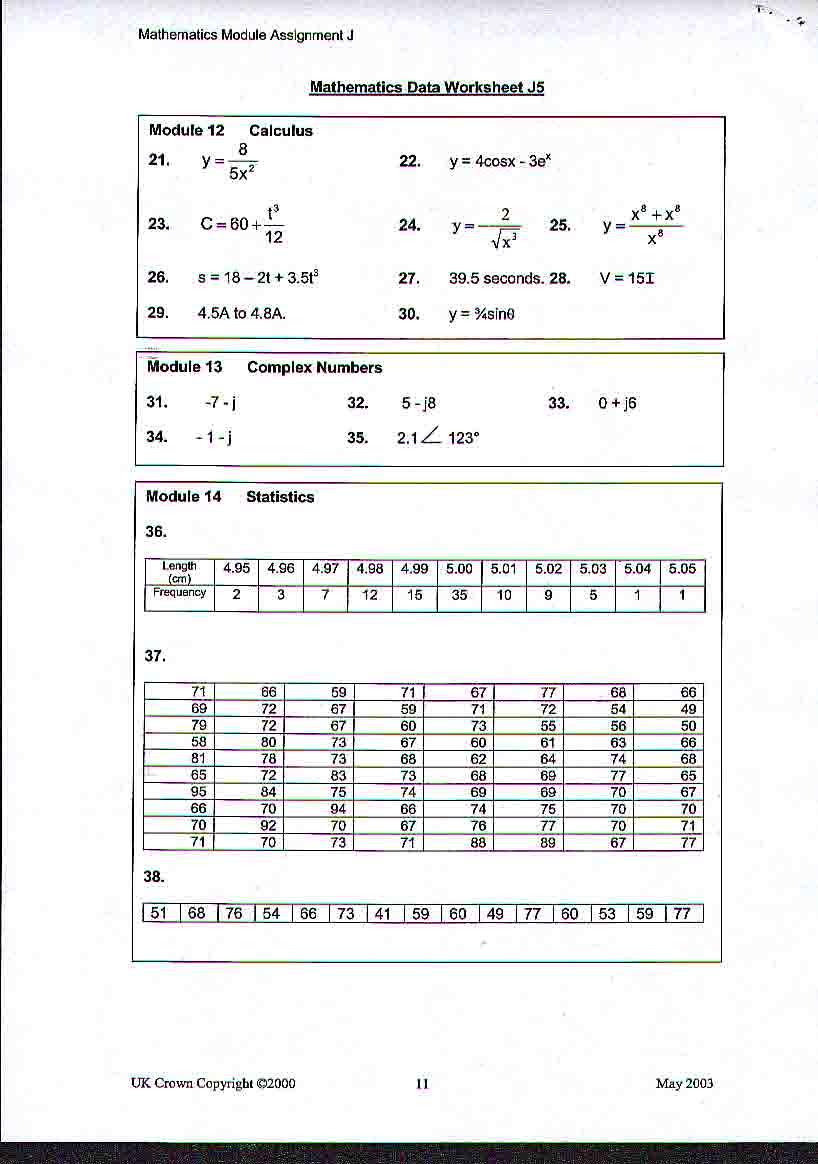
A. 100 lengths of steel bar were measured and their lengths In centimetres (cm) are given in the table labelled Item 36 on your worksheet.
i) Plot a histogram of the data provided.
ii) Calculate forthe data:
a) The arithmetic mean length. (Show all working).
b) The standard deviation from the mean. (Show all
working).
iii) Out of the 100 lengths of steel bar, approximately how many fall outside ±2 deviations from the mean? (Show all working).
B. Refer to the data, given as Item 37 on your worksheet. The data relates to examination scores for a sample of 80 BTEC (NC) students.
i) Group the data into 5 equal class widths and then produce a normal curve of distribution for the data.
ii) Calculate the standard deviation for the data and clearly show the arithmetic mean and 1 deviation around the mean on your normal curve of distribution.
C. Refer to the data given as Item 38 on your worksheet. The data given represents the marks out of 80 for 15 students In a BTEC distance learning assignment.
I) Calculate the mean median and modal marks.
ii) Two students who scored 76 and 54 respectively were later disqualified for cheating and their marks removed from the data
set. Calculate the mean, median and mode for the reduced set of marks.
iii) Compare the two sets of results arid explain in your own words what feature of the different types of average the new results illustrate. Make clear within your answer, which of the three different averages you think we should use for further
mathematical work on this data. Give reasons why.
Purchase this Solution
Solution Summary
Histograms, mean, median and mode, standard deviation and variance are investigated. The solution is detailed and well-presented. Diagrams are included and full working is shown.
Purchase this Solution
Free BrainMass Quizzes
Measures of Central Tendency
This quiz evaluates the students understanding of the measures of central tendency seen in statistics. This quiz is specifically designed to incorporate the measures of central tendency as they relate to psychological research.
Terms and Definitions for Statistics
This quiz covers basic terms and definitions of statistics.
Measures of Central Tendency
Tests knowledge of the three main measures of central tendency, including some simple calculation questions.
Know Your Statistical Concepts
Each question is a choice-summary multiple choice question that presents you with a statistical concept and then 4 numbered statements. You must decide which (if any) of the numbered statements is/are true as they relate to the statistical concept.