Probability Model; Decision Maker is Risk Neutral; Test Results
Not what you're looking for?
See attached file.
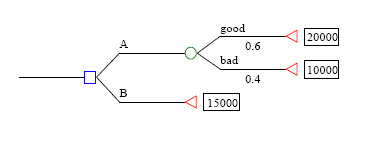
A decision maker is faced with the problem shown. Assume that the decision maker is risk neutral.
a) A test is available that will provide information about the possible outcomes associated with A. Add a branch called 'do the test' to the decisions below. Show how the test can be used to guide the selection of A or B. Previous evaluations of the test's performance indicate that when the outcome was 'good' the test indicated 'good' 90% of the time. Given that the outcome was 'bad', the test predicted 'bad' 40% of the time. What is the value of the information in the test? What is the optimal strategy for the decision maker to follow?
b) Suppose the test results in the past show that the test predicted 'good' 50% of the time when the outcome was 'good' and predicted 'bad' 50% of the time when the outcome was 'bad'. What is now the value of the information in the test? Why? What is the optimal strategy when this test is used?
c) What is the value of perfect information about outcome A?
Purchase this Solution
Solution Summary
The solution determines the results of the test.
Solution Preview
See the attached file.
Probability Model
A decision maker is faced with the problem shown. Assume that the decision maker is risk neutral.
a) A test is available that will provide information about the possible outcomes associated with A. Add a branch called "do the test" to the decisions below. Show how the test can be used to guide the selection of A or B. Previous evaluations of the test's performance indicate that when the outcome was "good" the test indicated "good" 90% of the time. Given that the outcome was "bad", the test predicted "bad" 40% of the time. What is the value of the information in the test? What is the optimal strategy for the decision maker to follow?
First, we calculate the probabilities that the test performance would indicate "good" and "bad" outcome:
Test Forecast Event P(Event) P(Forecast/Event) P(Forecast and Event) P(Event/Forecast)
Good Good 0.6 0.9 =0.6*0.9=0.54 =0.54/0.78=0.69
Bad 0.4 0.6 0.24 0.31
P(Forecast is ...
Purchase this Solution
Free BrainMass Quizzes
Know Your Statistical Concepts
Each question is a choice-summary multiple choice question that presents you with a statistical concept and then 4 numbered statements. You must decide which (if any) of the numbered statements is/are true as they relate to the statistical concept.
Terms and Definitions for Statistics
This quiz covers basic terms and definitions of statistics.
Measures of Central Tendency
Tests knowledge of the three main measures of central tendency, including some simple calculation questions.
Measures of Central Tendency
This quiz evaluates the students understanding of the measures of central tendency seen in statistics. This quiz is specifically designed to incorporate the measures of central tendency as they relate to psychological research.