Optimal level of parties
Not what you're looking for?
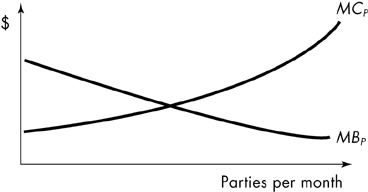
In the accompanying figure, the number of parties that Cassanova gives per month is measured on the horizontal axis, and dollars are measured on the vertical. MCp is the marginal cost of providing parties and MBp is Cassanova's marginal benefit schedule from having parties.
a. Graphically, show how many parties Cassanova will host.
b. Suppose there is a fixed marginal benefit, $b, per party to Cassanova's friends. illustrate this on your graph.
c. What is the socially (no pun intended) optimal level of parties? How could the Social Committee induce Cassanova to host this number of parties?
d. 0n your graph, show the optimal subsidy per party and the total amount paid to Cassanova. Who gains and loses under this plan?
Purchase this Solution
Solution Summary
Marginal costs and benefits of parties used to demonstrate optimal subsidy levels
Solution Preview
a. See the attached file. He will host parties until the MCp of the last party is the same as the MBp he derives from the last party. This would be described as C number of ...
Purchase this Solution
Free BrainMass Quizzes
Economic Issues and Concepts
This quiz provides a review of the basic microeconomic concepts. Students can test their understanding of major economic issues.
Elementary Microeconomics
This quiz reviews the basic concept of supply and demand analysis.
Pricing Strategies
Discussion about various pricing techniques of profit-seeking firms.
Basics of Economics
Quiz will help you to review some basics of microeconomics and macroeconomics which are often not understood.
Economics, Basic Concepts, Demand-Supply-Equilibrium
The quiz tests the basic concepts of demand, supply, and equilibrium in a free market.