Unemployment and inflation
Not what you're looking for?
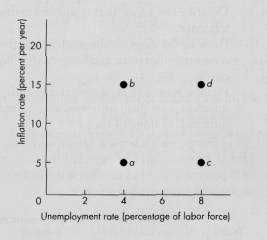
An economy has an unemployment rate of 4 percent and an inflation rate of 5 percent a year at point A in the figure
**figure attached**
Some events occur that move the economy in a clockwise loop from A to B to D to C and back to A.
A) Describe the events that could create this sequence.
B) Draw in the figure the sequence of the economy's short-run and long-run Phillips curves.
C) Has the economy experienced demand-pull inflation, cost-push inflation, expected inflation or none of the these?
Purchase this Solution
Solution Summary
How the phillips curve illustrates the relationship between unemployment and inflation
Solution Preview
The Phillips curve shows us a short term trade off between unemployment and inflation, given fixed costs of production and inflationary expectations. It works when changes in aggregate demand are the primary drivers of economic activity. The trade off is only valid in the short run; in the long run unemployment levels are dictated by the natural rate of ...
Purchase this Solution
Free BrainMass Quizzes
Elementary Microeconomics
This quiz reviews the basic concept of supply and demand analysis.
Economics, Basic Concepts, Demand-Supply-Equilibrium
The quiz tests the basic concepts of demand, supply, and equilibrium in a free market.
Basics of Economics
Quiz will help you to review some basics of microeconomics and macroeconomics which are often not understood.
Pricing Strategies
Discussion about various pricing techniques of profit-seeking firms.
Economic Issues and Concepts
This quiz provides a review of the basic microeconomic concepts. Students can test their understanding of major economic issues.