Intersects & Demand Graphs
Not what you're looking for?
Please explain step-by-step how to do these. thanks!
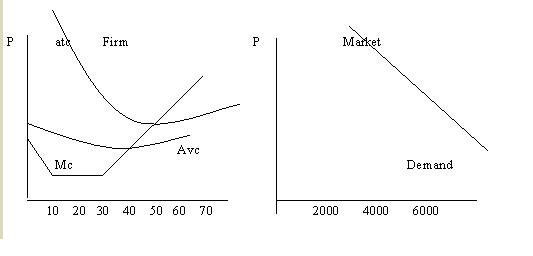
6) In the above diagrams assume the following: MC intersects AVC @ P= $8, Q=40 and MC intersects ATC @ P= $12, Q = 50. (Min MC =$ 4). In the market demand schedule on the right, at a price of $16, the quantity demanded = 6000, and at a price of $12 the quantity demanded rise to 7000.
a) What is the output of a typical firm when the market price is $16?
b) What is the lowest price at which the typical firm will stay in business in the short run?
c) If there are currently 100 firms in this industry. Draw the short run market supply curve.
Purchase this Solution
Solution Summary
Intersects & Demand Graphs are studied.
Solution Preview
A)
<br>The difficulty with this question is in cutting through the data and understanding it.
<br>Let us start with the question what do we want in part a ?
<br>To get the output of the firm when the price is $16, let us reinterpret the question: what is the quantity that the firm can sell when the market price is $16?
<br>Let us assume that the firm maximizes profit. Thus, marginal Cost = Marginal Revenue. The marginal revenue is the price the market is ready to pay which is $16. Marginal cost = ...
Purchase this Solution
Free BrainMass Quizzes
Pricing Strategies
Discussion about various pricing techniques of profit-seeking firms.
Basics of Economics
Quiz will help you to review some basics of microeconomics and macroeconomics which are often not understood.
Economic Issues and Concepts
This quiz provides a review of the basic microeconomic concepts. Students can test their understanding of major economic issues.
Elementary Microeconomics
This quiz reviews the basic concept of supply and demand analysis.
Economics, Basic Concepts, Demand-Supply-Equilibrium
The quiz tests the basic concepts of demand, supply, and equilibrium in a free market.