A control chart is used to measure the statistical control associated with manufacturing processes and thus, plots the lower and upper control limits to measure deviations from the controlled state. Control charts are particularly effective for graphing manufacturing processes since these practices are rarely free from variation and are not usually in a state of statistical control. To be in a state of statistical control means that assignable variation, which results from factors such as poorly trained operators or faulty machines to name a couple, is eliminated (1). In the manufacturing industry, there are always various factors at play and control charts represent a way of detecting factors which cause a severe deviation from statistical control.
A control chart is comprised of a few specific features. For one, it always has a line plotted for the average, which is called the central line. The average being plotted in a control chart is the expected average that the process should be functioning at or the average quality of the process. These charts also always have an upper control limit line and lower control limit line drawn in around the central line and these lines are based both from chance and historical data.
For control charts to be effective, samples should be taken at a certain interval over time and this new data should be frequently plotted. This ensures that the control associated with a manufacturing process can be monitored. Furthermore, it is important to note that there are two types of control charts: control charts for measurements and control charts for attributes (1). The type of chart used depends on whether the data being plotted is counted, such as the number of faulty products in a sample, or measured.
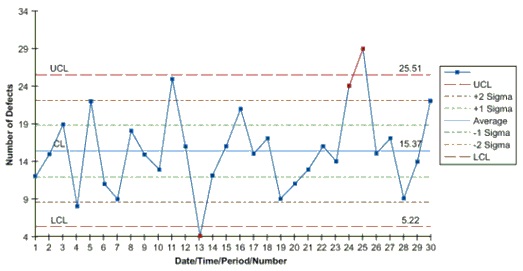
Figure 1. This figure has been taken from: http://www.isixsigma.com/tools-templates/control-charts/a-guide-to-control-charts/. The central line is in light blue. The lower and upper limit lines are represented by the dashed red lines.
The above figure, Figure 1¸ provides an example of a control chart for attributes since the observations being measured are counts. Control charts are very effective charts to use in the manufacturing industry and can assist in trying to maintain statistical control in the manufacturing process.
References:
1. Miller, I and Freund, J. (2011). Probability and Statistics for Engineers – 8th Edition. Pearson Education, Inc.: U.S.A.
2. http://www.isixsigma.com/tools-templates/control-charts/a-guide-to-control-charts/