A probability density function (pdf) is used when you are dealing with continuous random variables. Remember, a continuous random variable is something like time where there is no distinct separation between one value and the next as opposed to discrete random variables such as number of apples. An example of a probability density function that follows a normal distribution:
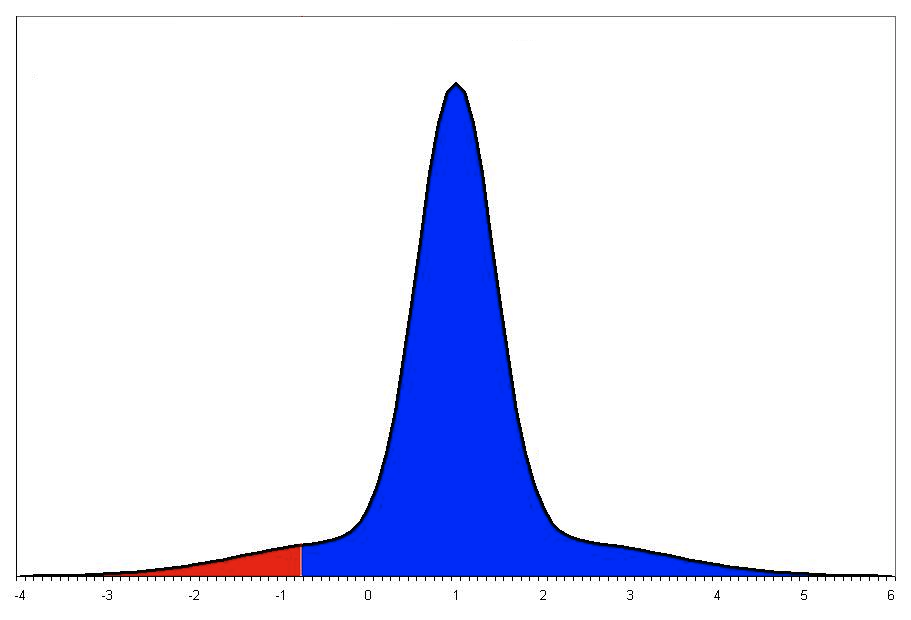
The x-axis reflects the values of the continuous random variable. The probability of a range of variables will be given by the integral of the curve for that range, or the area under the graph. Since the graph represents all possible values of your continuous random variable, the area under the entire graph is exactly equal to one. Note that the probability of a single instance occurring is infinitesimally small. For example, consider a rolling ball. With reference to a probability density function, you could determine what the probability is for the ball to stop rolling at some point between 5 seconds and 10 seconds from now. But, the probability of the ball stopping at exactly the 5th second, and not even a fraction of a millisecond earlier or later, would be infinitesimally small.
© BrainMass Inc. brainmass.com April 23, 2024, 5:38 pm ad1c9bdddf