Standard Deviation
Not what you're looking for?
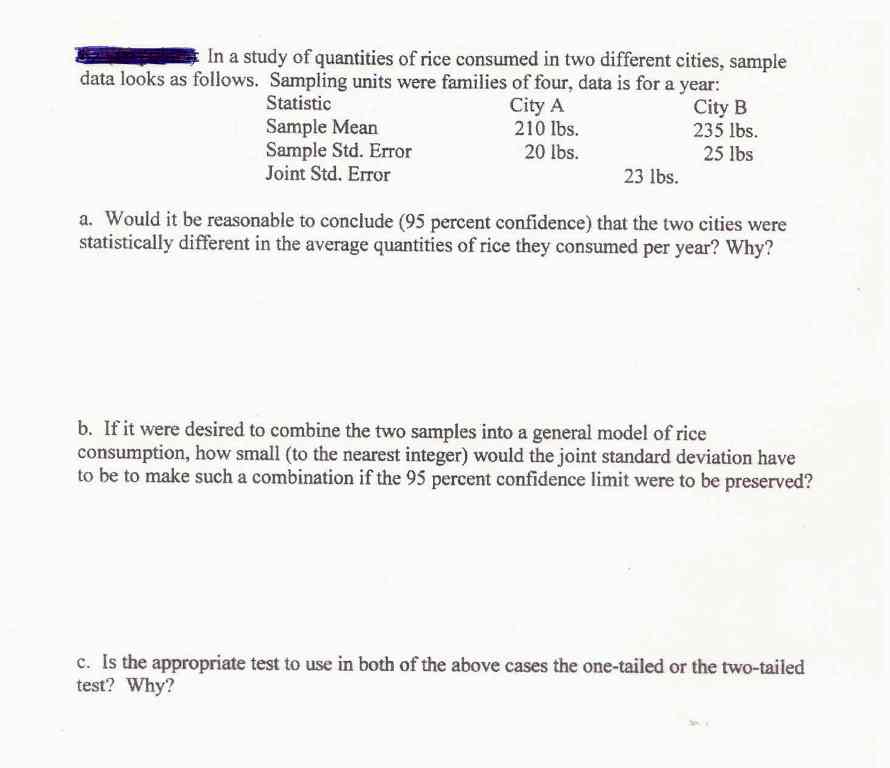
In a study of quantities of rice consumed in two different cities, a sample data looks as in the attachment. Sampling units were families of four, data is for a year.
a. Would it be reasonable to conclude (95 percent confidence) that the two cities were statistically different in the average quantities of rice they consumed per year? Why?
b. If it were desired to combine the two samples into a general model of rice consumption, how small (to the nearest integer) would the joint standard deviation have to be to make such a combination if the 95 percent confidence limit were to be preserved.
c. Is the appropriate test to use in both of the above cases the one-tailed or the two-tailed test? Why?
Purchase this Solution
Solution Summary
In a study of quantities of rice consumed in two different cities, a sample data looks as in the attachment. Sampling units were families of four, data is for a year. The solution answers multiple questions regarding statistics and provides a brief discussion on each.
Solution Preview
Solution is attached.
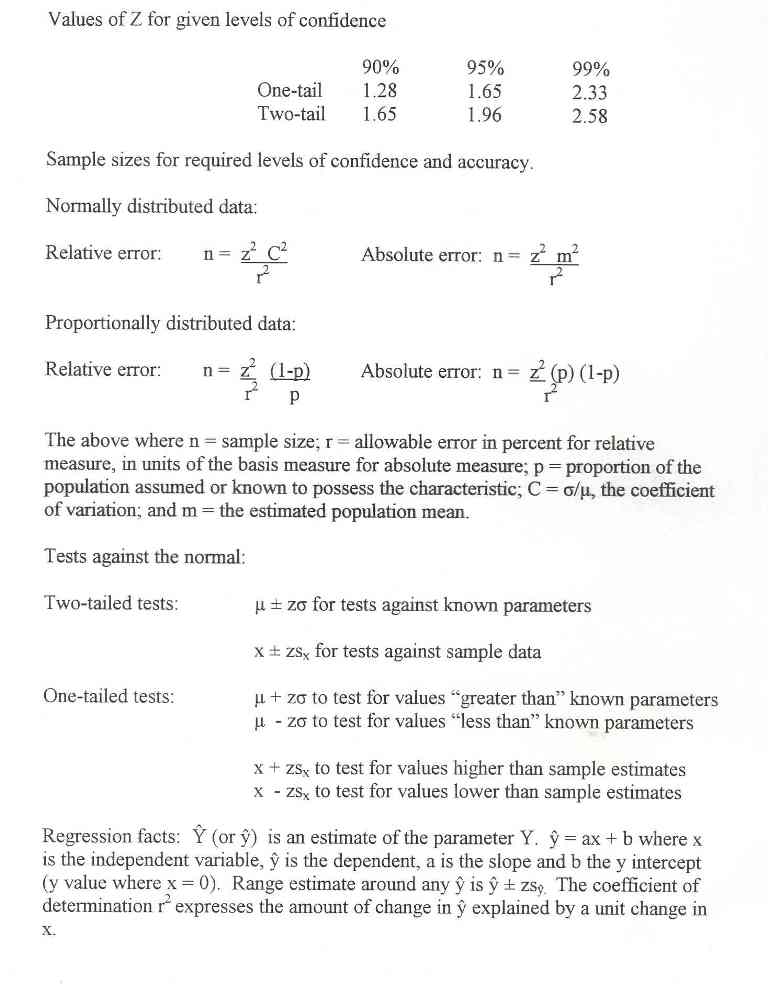
a) Since the sample sizes are very large, we can use z-test. WE know that
City A City B
Sample mean 210lbs 235lbs
Sample Std error 20lbs 25lbs
Joint Std error ...
Education
- BSc , Wuhan Univ. China
- MA, Shandong Univ.
Recent Feedback
- "Your solution, looks excellent. I recognize things from previous chapters. I have seen the standard deviation formula you used to get 5.154. I do understand the Central Limit Theorem needs the sample size (n) to be greater than 30, we have 100. I do understand the sample mean(s) of the population will follow a normal distribution, and that CLT states the sample mean of population is the population (mean), we have 143.74. But when and WHY do we use the standard deviation formula where you got 5.154. WHEN & Why use standard deviation of the sample mean. I don't understand, why don't we simply use the "100" I understand that standard deviation is the square root of variance. I do understand that the variance is the square of the differences of each sample data value minus the mean. But somehow, why not use 100, why use standard deviation of sample mean? Please help explain."
- "excellent work"
- "Thank you so much for all of your help!!! I will be posting another assignment. Please let me know (once posted), if the credits I'm offering is enough or you ! Thanks again!"
- "Thank you"
- "Thank you very much for your valuable time and assistance!"
Purchase this Solution
Free BrainMass Quizzes
Measures of Central Tendency
This quiz evaluates the students understanding of the measures of central tendency seen in statistics. This quiz is specifically designed to incorporate the measures of central tendency as they relate to psychological research.
Know Your Statistical Concepts
Each question is a choice-summary multiple choice question that presents you with a statistical concept and then 4 numbered statements. You must decide which (if any) of the numbered statements is/are true as they relate to the statistical concept.
Terms and Definitions for Statistics
This quiz covers basic terms and definitions of statistics.
Measures of Central Tendency
Tests knowledge of the three main measures of central tendency, including some simple calculation questions.