An F-test is a form of hypothesis testing used for comparing variances using the F-distributions, with varying degrees of freedom. F-distributions were developed by George W. Snedecor in honour of R.A. Fisher. F-tests are used to test whether the variances of two samples are equal; this is the null hypothesis. The advantage of the F-test is that it can be used to compare multiple samples at the same time. Another way to think of the F-test is that it tests how well a particular regression fits the data set. In this case the F-statistic can be calculated by:
F = explained variance / unexplained variance,
or
F = between-group variability / within-group variability
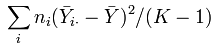
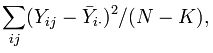
After calculating the F-statistic we can compare it to the critical value to determine whether the null hypothesis can or cannot be rejected at the specified significance level. The explained variance is calculated by taking the sum of the square of the difference between the means for each group of data and the overall mean of the data set multiplied by the number of observations, and divided by one less the number of groups. Hence, it is known as the between-group variability because it compares the variability of each group to the overall level. The unexplained variance is the sum of every group's differences between each observation of each group and that group's mean squared, and then divided by the number of observations less the number of groups. It is the within-group variability because it compares the variance between the observations and the means within each group. Formally the explained and unexplained variances are shown below respectively where: n is the number of observations for the specific group, i is the counter for the groups, j is the counter for observations, Y is the specific observation, Ῡ is the mean, N is the overall sample size, and K is the number of groups.