A contingency table presents data for more than one categorical variable over usually five or less levels. In comparison to a frequency table, a contingency table differs because it has a more complex nature. It is basically a multivariate frequency table.
A contingency table can be used to measure and compare the proportions between different variables. When comparing the proportions, different statistical tests can be utilized to measure the significance between the differences of the proportions. A Fisher’s exact test and a Chi-square test are two possible statistical tests which can be used.
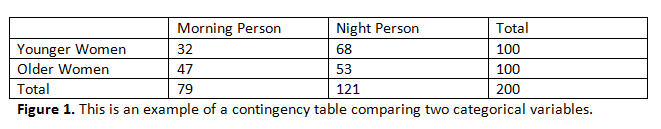
Here is an example illustrating when a contingency table is appropriate to use:
Scenario: Pretend you were comparing sleep patterns between 100 older women and 100 younger women. Older women are considered to be 40 and over, whereas younger women are under 40. In terms of sleep patterns, you ask the women to classify themselves as a morning person or night person. This can be tabulated in a 2x2 contingency table, which is represented by Figure 1 below.
A contingency table is a useful tool which can be utilized in statistics. When comparing multiple categorical variables and measuring their association with each other, a contingency table resembles a great method of not only presenting the data, but comparing the variables with each other.
© BrainMass Inc. brainmass.com April 19, 2024, 2:05 am ad1c9bdddf