In the capital asset pricing model (CAPM), we look at how the interrelationship between securities contributes to the risk and, as a result, the expected return of a security. Both the arbitrage pricing theory (APT) and the CAPM demonstrate this same positive, linear correlation between risk and return. However, unlike the CAPM, the APT looks at how individual factors contribute to a security's return. Some factors are unsystematic - they only affect a single stock. These are factors such as the success of a company's research and development. Other factors are systematic - these factors affect more than one stock at the same time. Systematic risk is often referred to as market risk, and includes things such as inflation and interest rates. Using the APT, we see that the interrelationship between securities is dependent on the extent that these securities are affected by the same systematic factors.
We therefore break the return of a stock into two main parts: the expected part of the return and the unexpected part of the return. That is to say, if a stock's return was always the same as its expected return - there would be no risk.
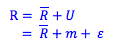
Where,
R = the actual return on the stock
 = the expected part fo the return
U = unexpected risk
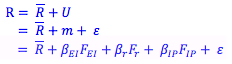
m = systematic risk, or market risk
ε = unsystematic risk
In the real world, stock returns have risk, and the value of a stock in any given month often changes based on new information about the factors that affect the stock's future prospects and its risk. This new information is often given in the form of an announcement. Here we have to be careful, because not all information provided in an announcement is unexpected. For example, the Federal Reserve might announce an interest rate hike on T-Bills from 1.5% to 2.5%. Investors may have already expected an interest rate hike of 0.5%, and this information may have already been discounted, that is, used by investors in evaluated the expected part of the return of the stock. The portion of the information therefore that is a surprise, is a factor in the unexpected return - in this case, the 0.5% rise in interest rates investors did not expect. 
Like the CAPM, we use a beta coefficient to represent how the price of a stock moves relative to surprise factors that make up the systematic risk. In the following, FEI is the surprise factor, equal to the surprise change in expected inflation, and βEI relates how this change affects the actual return on the stock. The subscripts r and IP refer to unexpected change in interest rates and unexpected change in industry production respectively. As you can imagine, a factor model like the APT can be built with many different factors, and no one model is the right model.
Using the APT, we can also build a model for the return for a portfolio. The return on a portfolio is equal to the weighted average of the returns on each individual stock, where X represents the proportion each stock is weighted in a portfolio. Here we want to use a one-factor model to simplify things. We can use a single factor in this case such as the return on a market index such as the S&P 500.

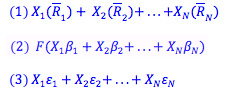
As we can see, the return on a portfolio is related to three sets of parameters:
- The expected return on each individual security,
- The beta of each security multiplied by the factor F
- The unsystematic risk of each security, ε
In fact, we can find the return of the portfolio as (1) the weighted average of the expected returns on each stock, plus (2) the weighted average of the beta coefficients multiplied by the factor F, plus (3) the weighted average of each stock's unsystematic risk. In fact, the larger a portfolio is, the more the unsystematic risks of each stock counteract one another - eventually, with a large enough portfolio, (3) will be equal to zero.
Let's take a look back at the security market line we introduced under CAPM. Security P represents our large portfolio (in this case, the market portfolio), or a security with equal beta and return to it. An investor can either invest in our portfolio, or in a combination of some other security and a riskless asset. An investor looking for higher risk, and higher returns, may invest in security A or B, or may leverage her investment by borrowing at the risk-free rate and investing in P. A low risk investor may invest in P, or may invest in some combination of A or B and a risk-free asset. No matter her risk tolerance, she can find a combination that suits her. Now consider security C. No investor would invest in a security with that much risk and only so much return. This security is overpriced, and in a competetive market its price will fall until it matches the security market line.
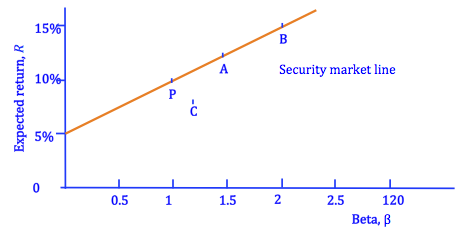
A stock that has a beta of zero in this example always returns the expected return in our one-factor model. Similarly, for our very large portfolio, the weighted average of the betas of our portfolio will be equal to one. We could have a portfolio at A or B if we wanted to take on more risk, but let's say we're the average investor, so we want to invest at P. In fact, the stocks at A or B will have some beta higher than one. We can use this beta to determine the expected return for these stocks or portfolios. We know this relationship exists, because these portfolios can be duplicated by borrowing at RF and buying P: if a stock is overpriced, we would prefer to duplicate its risk and get a higher return by using this strategy, and if a stock is underpriced, market demand will push its price back up. Therefore, we end up with a relationship that looks like this, where is the expected return of any security lying on our security market line.
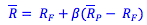
Does this look familiar? It should. The capital asset pricing model uses beta to measure a security's responsiveness to movements in the market portfolio; whereas the APT uses beta to measure a security's responsiveness to different factors. When we use a one-factor APT model, we end up with a very similar formula to the capital asset pricing model. In fact, if the factor we decide to use in our one-factor model is change in the market portfolio, the APT and the CAPM are identical.
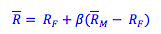
Photo by Markus Spiske on Unsplash
© BrainMass Inc. brainmass.com April 20, 2024, 5:53 am ad1c9bdddf